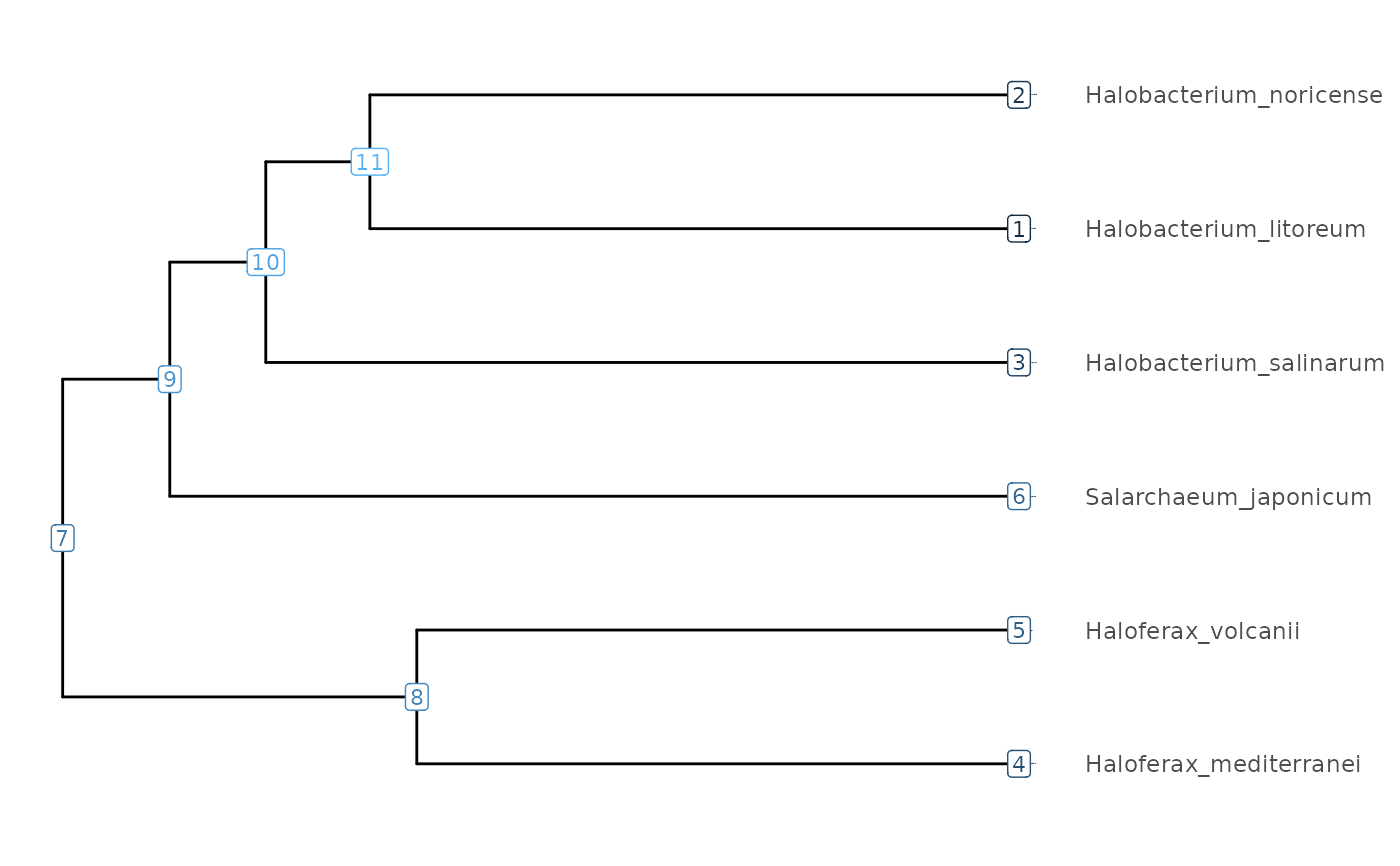
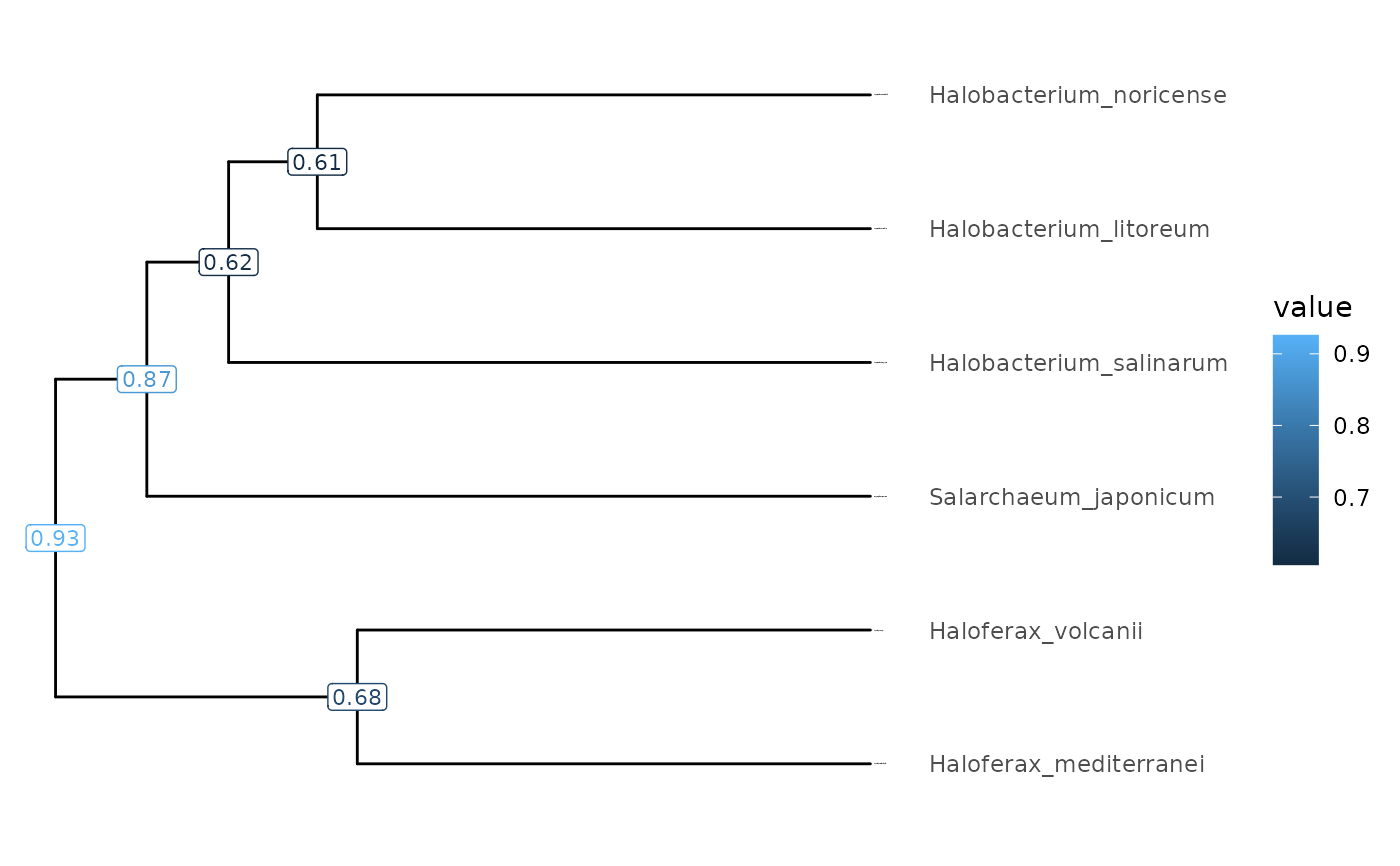
Plot a phylogenetic tree and its node data
Usage
visualizeTree(
  your_tibble,
  value = "node",
  valueround = 2,
  outerlabelsize = 0.25,
  innerlabelsize = 3,
  ynudge = 0,
  xnudge = 0
)
Arguments
- your_tibble
A
ConvenientTblTreeobject.- value
Tibble value to label on internal nodes of the tree, or name of a column in the tree object.
- valueround
Number of integers to round value.
- outerlabelsize
Size of label border.
- innerlabelsize
Overall size of label.
- xnudge, ynudge
Adjust horizontal or vertical position of labels (useful when plotting multiple labels).
Value
A phylogenetic tree showcasing phylogeny of species, additional node values, or just node IDs. No legend is show when displaying node IDs.
See also
Other Focal clade functions:
eog(),
focalClade(),
recordAncestor(),
recordClades(),
subMatrix(),
subTree()
Other Plotting functions:
MRCA_2D_plot(),
ellipsePlot(),
treeHeatMap()