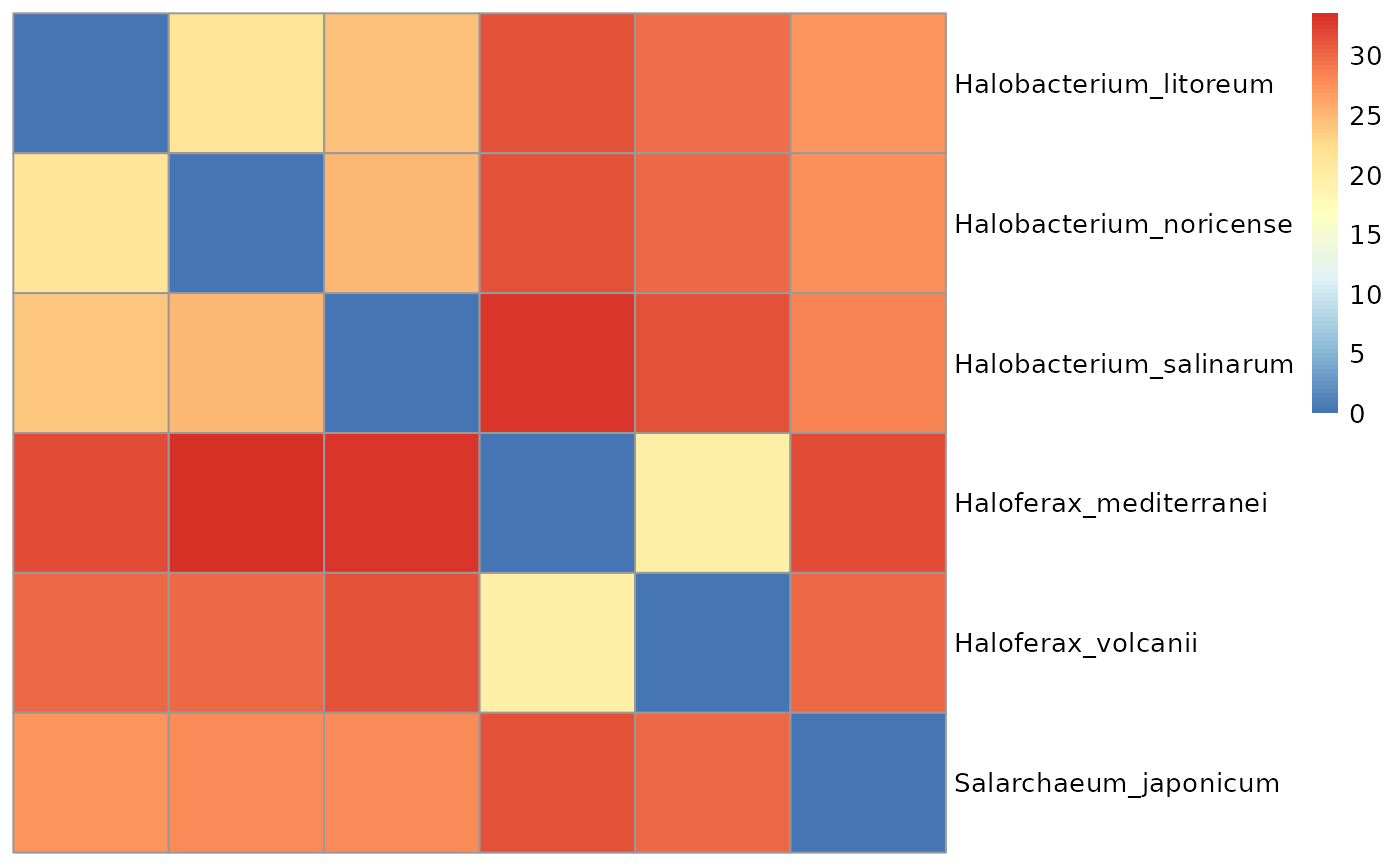
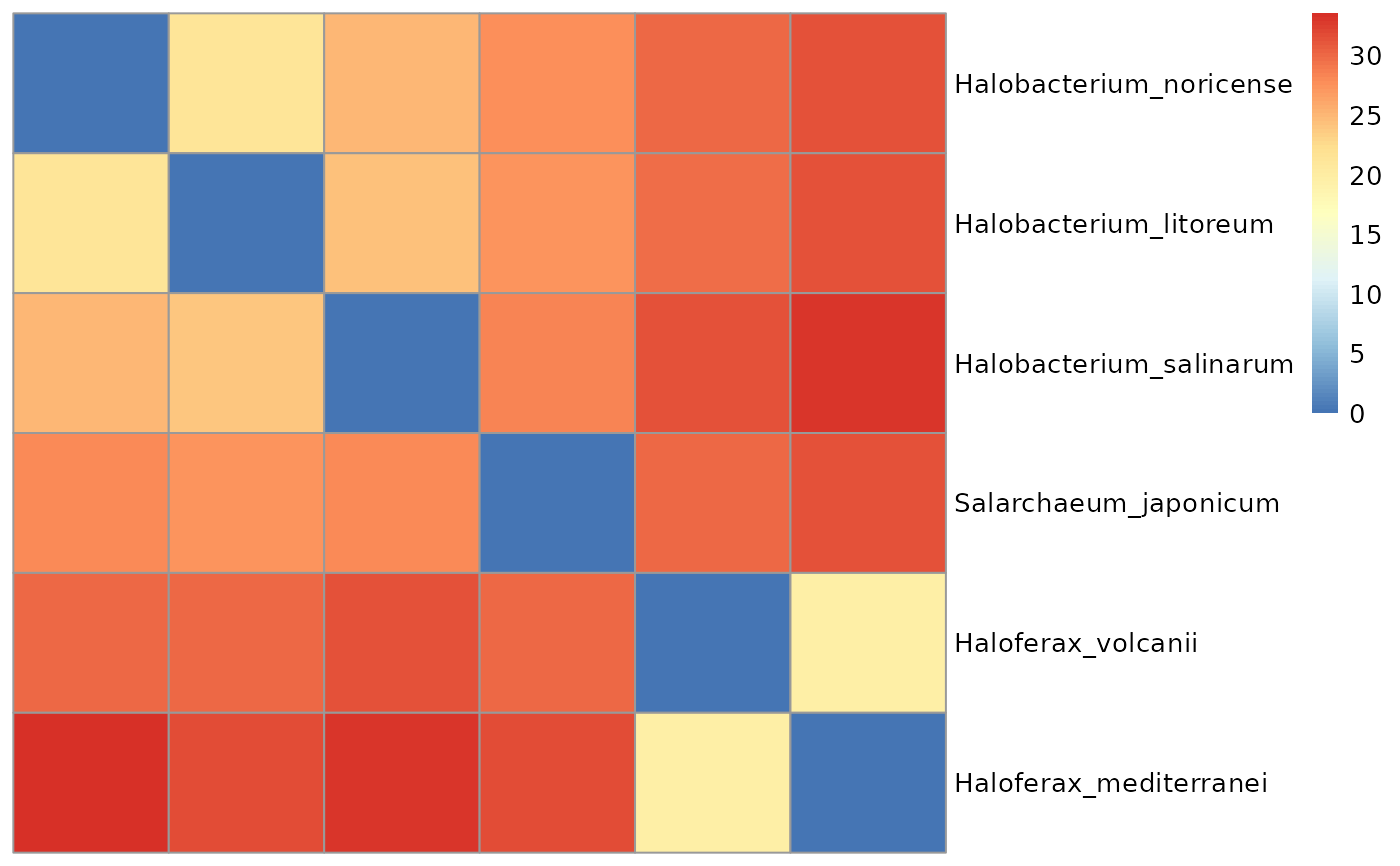
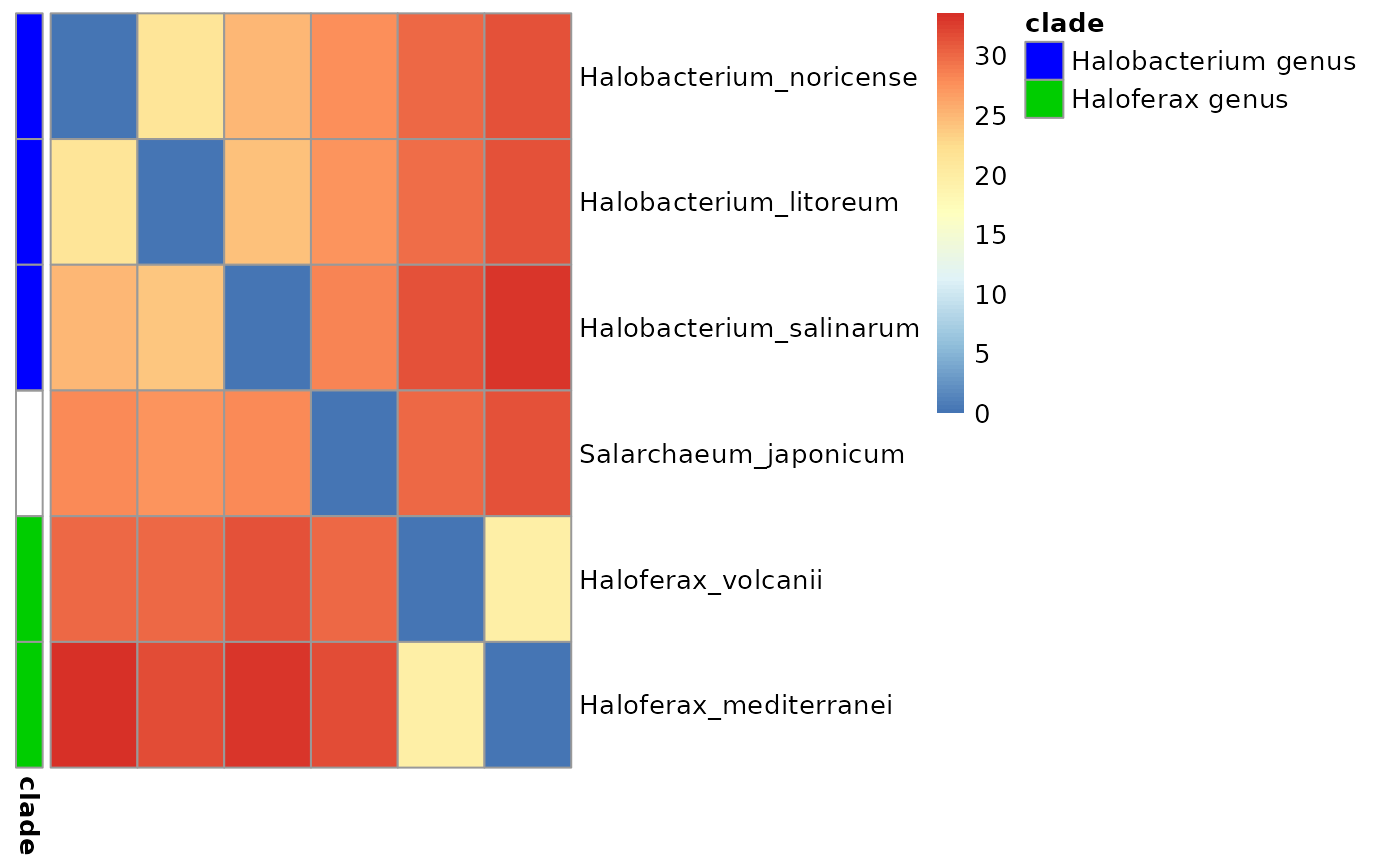
Takes a matrix, a tree, and optionally some focal clades to plot a heatmap clustered with that tree. Obviously, the tree and the matrix need to be related.
Arguments
- mat
a matrix with numerical values.
- tree
A
ConvenientTblTreeobject.- clades
A
FocalCladeListobject.- ...
Extra arguments passed to
pheatmap::pheatmap()
See also
Other Plotting functions:
MRCA_2D_plot(),
ellipsePlot(),
visualizeTree()